 Traveling the way we do, we really appreciate the natural world around
us, and have become very aware of the fragility of ecosystems in the face of
climate change. Whether it’s waterfront campsites (not to mention whole
archipelagos) threatened by rising sea levels, or
“sky islands” surrounded by
desert (whose isolated species have no cooler climes to migrate to), or
glaciers that are just plain disappearing, we feel that
we have a personal and vested interest in slowing the pace of global warming.
For me, this naturally led to an interest in establishing just what the carbon
footprint of our RV lifestyle is; we’d like to think that it’s minimal, but is
it really? Do our solar panels and tiny house offset the impact of the hulking F-550
we have to use as a daily driver? These questions bugged me for years during
our fulltiming hiatus, and after we got
back on the road, I was determined to find out.
Traveling the way we do, we really appreciate the natural world around
us, and have become very aware of the fragility of ecosystems in the face of
climate change. Whether it’s waterfront campsites (not to mention whole
archipelagos) threatened by rising sea levels, or
“sky islands” surrounded by
desert (whose isolated species have no cooler climes to migrate to), or
glaciers that are just plain disappearing, we feel that
we have a personal and vested interest in slowing the pace of global warming.
For me, this naturally led to an interest in establishing just what the carbon
footprint of our RV lifestyle is; we’d like to think that it’s minimal, but is
it really? Do our solar panels and tiny house offset the impact of the hulking F-550
we have to use as a daily driver? These questions bugged me for years during
our fulltiming hiatus, and after we got
back on the road, I was determined to find out.
 I soon realized that, with a bit of record-keeping, establishing our
personal carbon footprint was quite do-able. The bulk of carbon emissions come
from energy usage, and energy consumption is fairly straightforward to track:
it’s mostly fuel and electricity. There are also a few indirect carbon
impacts, such as food consumption, where the energy is spent by something
we’re consuming rather than by ourselves; tracking these is less precise, but
a bit of research convinced me that I could find good enough approximations to
be going on with.
I soon realized that, with a bit of record-keeping, establishing our
personal carbon footprint was quite do-able. The bulk of carbon emissions come
from energy usage, and energy consumption is fairly straightforward to track:
it’s mostly fuel and electricity. There are also a few indirect carbon
impacts, such as food consumption, where the energy is spent by something
we’re consuming rather than by ourselves; tracking these is less precise, but
a bit of research convinced me that I could find good enough approximations to
be going on with.
I started keeping records of all these in January 2013, so as of this writing, I have over a year’s worth of data - and since energy usage tends to vary seasonally, a year should be enough to begin drawing some conclusions. Below you’ll find the categories I’ve been tracking, in (roughly) descending order of carbon emissions. For each, I’ll give the total I came up with for the two of us, along with comments on how I measured it - and how it might be reduced.
If you’re not interested in the nitty-gritty of all this, feel free to cut to the chase.
Carbon vs. CO2Before starting this project, one item which was always a bit unclear to me was the relationship between CO2 and carbon vis a vis climate impact. Sure, I understand the basics: CO2 (aka carbon dioxide) is a gas which is responsible for much of climate change, and carbon is one of the elements which comprises it. But in climate discussions you often hear the two terms tossed around almost interchangeably, and when it comes to quantifying emissions, you can’t be that imprecise: a kilogram of CO2 isn’t the same as a kilogram of carbon.
In short, what I found was that when you see numbers for carbon emissions, most of the time they’re actually referring to carbon dioxide. And that’s what I’ll be dealing with for the rest of this article - kilograms and tons fo CO2 - even though I may throw the word “carbon” in here or there to break up the monotony.
Diesel
 Without a doubt, our biggest carbon impact comes from the burning of
diesel fuel. The F-550 that carries our house is no
bigger than it needs to
be, but during the 2013 measurement period, our average mileage was only 9.56
MPG (24.6 L/100km). This is, in a word, atrocious - nearly five times the fuel
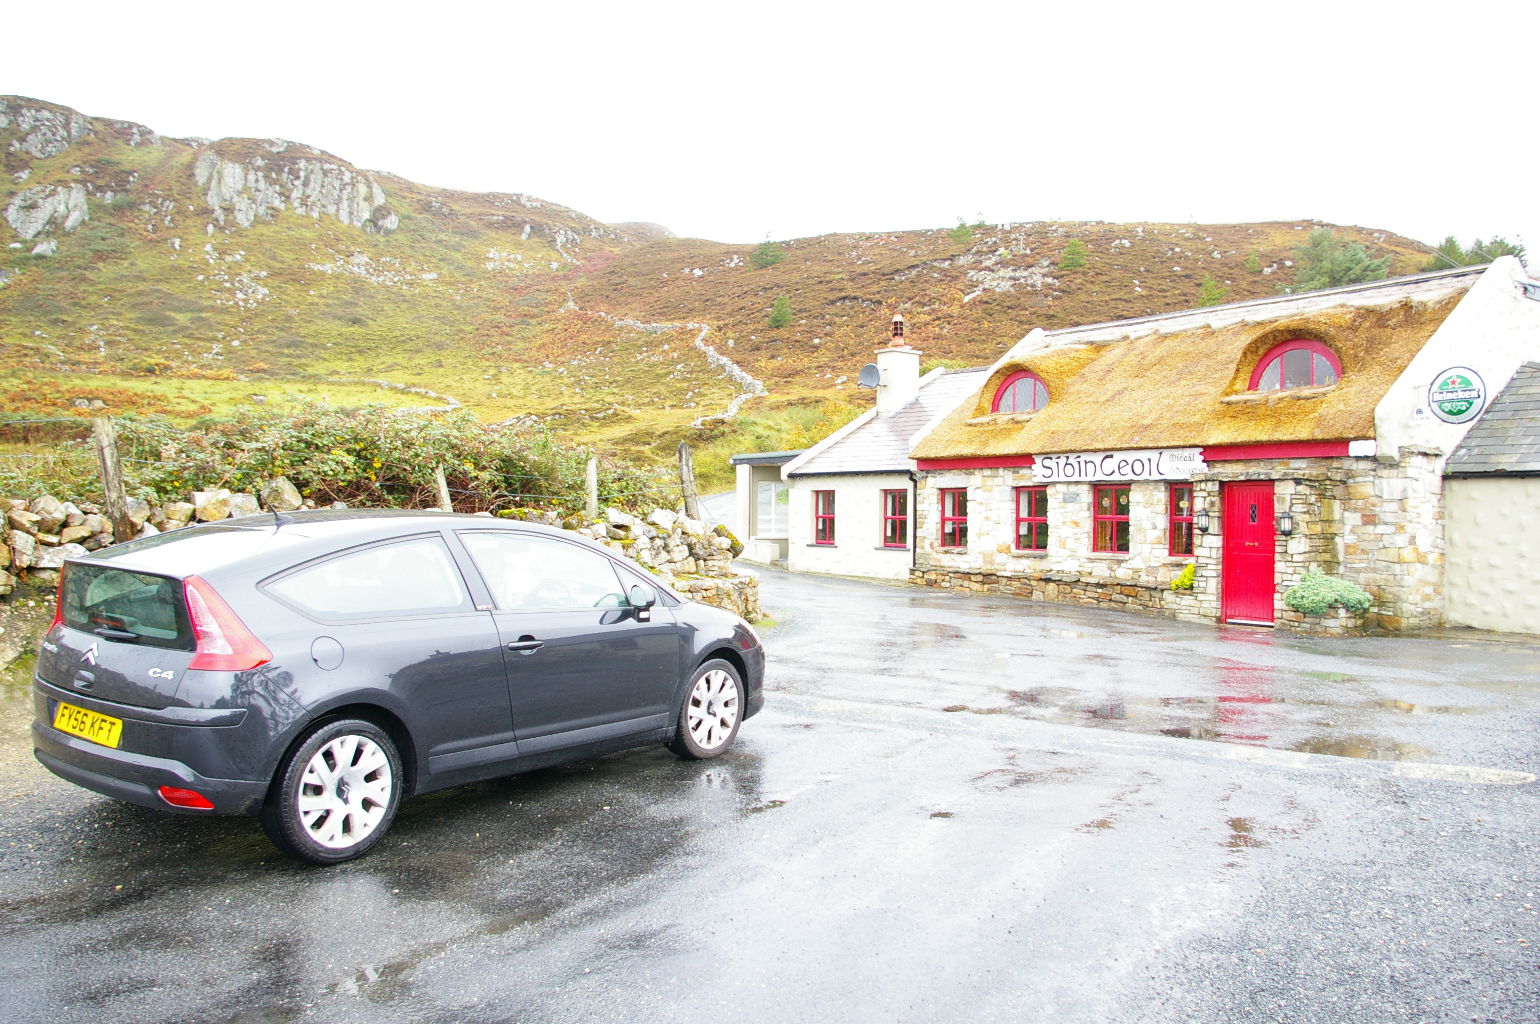
consumption of the diesel car we owned in Europe, a Citroen C4. We also drove
quite a few miles in 2013, over 17,000 all told. When you crunch the numbers,
this means that we burned 1781 gallons in the year, and at 10.15 kg CO2 per
gallon (source), this comes out
to 18,078.5 kg for the year. That’s over 77% of our total carbon dioxide
emissions right there.
Without a doubt, our biggest carbon impact comes from the burning of
diesel fuel. The F-550 that carries our house is no
bigger than it needs to
be, but during the 2013 measurement period, our average mileage was only 9.56
MPG (24.6 L/100km). This is, in a word, atrocious - nearly five times the fuel
consumption of the diesel car we owned in Europe, a Citroen C4. We also drove
quite a few miles in 2013, over 17,000 all told. When you crunch the numbers,
this means that we burned 1781 gallons in the year, and at 10.15 kg CO2 per
gallon (source), this comes out
to 18,078.5 kg for the year. That’s over 77% of our total carbon dioxide
emissions right there.
Obviously, if we want to reduce our carbon footprint, this is the biggest target to aim for. Unfortunately, there are really only two ways to do so: either improve the truck’s efficiency, or drive less. Some gains could conceivably be made in the former category, though we already do all the obvious things, like keeping tire pressures up and moderating our speed. And although drastic increases are unlikely, the starting fuel economy is so bad that even a modest boost could improve our bottom line substantially. For example, an increase of just one MPG would be about a ten percent gain in efficiency, reducing the truck’s CO2 emissions by about 1800 kg for a year like 2013 - that’s comparable to our next largest emissions category right there. Unfortunately, even these small gains are nontrivial (and expensive) to implement. My prime suspect in our low mileage is the truck’s 4.88:1 final drive ratio, and increasing that would probably mean either an overdrive or modifying the differentials at both ends. In other words, many thousands of dollars, not to mention unknown compatibility with our sweet TorqShift transmission.
 The second option - driving less - is much easier to accomplish, and it’s
a net money saver rather than an expense.
We really drove further than we would have liked in 2013: we decided to do
most of the east coast in a single summer, all the way to Labrador. In hindsight, it was too
ambitious. Since returning to the southwest, we’ve slowed our pace to
something that’s more comfortable, and find that we’re now driving about 200
miles per week (compare that with an average of 327 miles/week in 2013).
This probably won’t always be true, especially
when we have farther-flung places we want to be, but it’s a good goal.
The second option - driving less - is much easier to accomplish, and it’s
a net money saver rather than an expense.
We really drove further than we would have liked in 2013: we decided to do
most of the east coast in a single summer, all the way to Labrador. In hindsight, it was too
ambitious. Since returning to the southwest, we’ve slowed our pace to
something that’s more comfortable, and find that we’re now driving about 200
miles per week (compare that with an average of 327 miles/week in 2013).
This probably won’t always be true, especially
when we have farther-flung places we want to be, but it’s a good goal.
Which is what it comes down to: given that traveling is our life, there’s only so far that we can realistically push this “driving less” thing. At some point, we may just have to accept that diesel emissions are our biggest sin, and move on.
Food
From a category which is easy to quantify (we know exactly how much diesel fuel goes in the tank), we now come to another which is much more of a WAG. It’s a reality that agriculture is a major greenhouse gas emitter worldwide, but this impact isn’t something that you can really measure on an individual basis; about the best you can do is establish a total for a population and average it out.
 So, that’s what I’ve done: from carbonfund.org, I got a figure that an average
person's diet contributes 2545kg
of CO2-equivalent per year; that includes the other greenhouse gases
(methane, etc.) that farming produces. The same site says that a vegetarian
diet saves 3000lb/year (yes, they mix pounds and kilograms). Running these
numbers gives an estimated total for us of 2,459 kg CO2-e for the year; this
is our number-two source of greenhouse emissions, making up 10.5% of our
total.
So, that’s what I’ve done: from carbonfund.org, I got a figure that an average
person's diet contributes 2545kg
of CO2-equivalent per year; that includes the other greenhouse gases
(methane, etc.) that farming produces. The same site says that a vegetarian
diet saves 3000lb/year (yes, they mix pounds and kilograms). Running these
numbers gives an estimated total for us of 2,459 kg CO2-e for the year; this
is our number-two source of greenhouse emissions, making up 10.5% of our
total.
Reducing this component is bit funny - we can try to trim our impact, but because these figures are based on averages, nothing we do will actually trim the numbers. We’re already (virtually) meat-free, which is a good start, and we do try to eat locally-grown food where practical. Realistically, we could probably do more here - and we should probably try, even if our efforts won’t show up on the spreadsheet.
Propane
Having gotten diesel out of the way earlier, we now arrive at the fuel we use for everything else. Propane powers our stove and water heater, provides the heat for our furnace, runs our fridge when we’re not on hookups, and occasionally even generates electricity for us (more about that in a minute). And like diesel, it’s pretty easy to measure our footprint here: we know that we bought 192.7 gallons in 2013, and at 5.74 kg CO2 per gallon (source), that comes out to 1,106.2 kg. It’s not really a lot, only 4.7% of our total for the year.
And that’s just as well, because realistically, there’s not a whole heck
of a lot that we can do to reduce this. RV appliances are specialized enough
that replacing them with high-efficiency units often isn’t an option, and
where it is possible, it comes with other downsides. For example, I don’t
doubt that a good compressor fridge would be more efficient than the
 absorption unit we have, but it would either tie us to electric hookups or
require doubling the capacity of our batteries and solar - which we don’t have
the room for. We do conserve propane where we can: our thermostat is set at
55°F (12.8°C) overnight, the water heater is only on when we need it, and we
use a thermometer in the fridge/freezer to ensure it isn’t running harder than
it needs to. But there’s probably not much more we can do to reduce here.
absorption unit we have, but it would either tie us to electric hookups or
require doubling the capacity of our batteries and solar - which we don’t have
the room for. We do conserve propane where we can: our thermostat is set at
55°F (12.8°C) overnight, the water heater is only on when we need it, and we
use a thermometer in the fridge/freezer to ensure it isn’t running harder than
it needs to. But there’s probably not much more we can do to reduce here.
Using the fridge/freezer thermometer (pictured above) has taught me a couple of things about RV refrigerators.
First, there's a big difference in cooling efficacy from different power sources. Our fridge is what's known as a 3-way, meaning it can get its power from any of three different sources: propane gas, 120VAC (household) electricity, or 12VDC (automotive) electricity. And of the three, AC is the most effective, followed by propane, followed by DC. We have to use different settings on each to maintain the inside at its ideal temperatures.
And second, even beyond the power source, there's a lot more variability than you'd like. I've never monitored a domestic fridge this closely, but we regularly take ours over its full range of temperature control just to maintain some sort of equilibrium inside. Some of it's explainable by usage (like when we put a 6-pack in to cool), sometimes it's clearly linked to ambient temperature, but other times there is no obvious explanation.
However, I'm pretty sure that we've benefited from keeping tabs on it like this. We have fewer frozen vegetables in the fridge than we used to, and I think fewer instances of foods going bad as well. If you have an RV, I consider a thermometer like this a good investment.
Electricity
For most folks in stationary houses, electricity is one of their biggest
contributors to carbon dioxide emissions - but it’s also one of the easiest to
measure. Neither is true for us, with our portable electric system. Rather
than just coming from the mains, our electricity is generated from four
different sources:

- The solar panels on the camper roof, during daylight hours
- The alternators on the truck, when its engine is running
- Our onboard propane generator, on the rare occasions that we use it
- Shore power, when we plug into an electrical hookup
Of these four, the first is carbon-free, the second and third are accounted for in the usage of their respective fuels (already discussed), leaving only the fourth to try to measure for this analysis.
Occasionally it’s easy: some RV parks have an electric meter at each
site, and you literally pay for what you use. When we’ve been on sites like
this, I’ve dutifully recorded the meter readings, and included those in my
spreadsheet. And then, I’ve used these numbers to extrapolate how much power
we’ve used on unmetered hookups. For these purposes, I split such periods into
“days” and “nights”, divided at 5PM and 11AM. These times roughly correspond
to when we typically arrive and depart campgrounds, and this means that if we
just spend one night in a hookup site, that’s one 5PM-11AM slot. If we spend
multiple nights, I’ll also include the days between them. Over the course of
several extended stays on metered sites, I established that we use 1.85 kWH
during an average “day”, and 4.18 kWH during the “night”. Theses numbers are
for running our “baseline” load - lights, computers, fridge, etc. - but don’t
include the air conditioner, far and away the biggest electrical hog we have.
But we don’t use it much, so I’ve separately tracked the hours it was on - and
I estimate that it uses about 2 kW while running.

Putting all that together, in 2013 I estimated that we used 677 kWh of mains electricity. But then the next challenge is, what’s the CO2 emission from that? There’s no question that it varies widely, from Churchill Falls, NL (where we know for certain it was coming from the hydro plant of the same name) to Lake Colorado City, TX (where we were camped half a mile from a big oil-fired power plant). I’ve settled for a figure from the EPA that, on average, USA electricity sources emit 592.5 g CO2 per kWh; this means that our share for the year is 401.2 kg.
This is only 1.7% of our total emissions for the year, and what that low
figure really reflects is that we don’t use electrical hookups very often. And
consequently, like the Food total, the number that gets labeled Electricity is
something of a red herring. We can keep this number arbitrarily low simply by
avoiding hookups: as I write this in February 2014, we haven’t had one yet
 this year, which means that this column on my 2014 spreadsheet shows zero. But
that doesn’t mean we haven’t used any electricity, of course - it’s just come
from the other three sources I’ve listed above.
this year, which means that this column on my 2014 spreadsheet shows zero. But
that doesn’t mean we haven’t used any electricity, of course - it’s just come
from the other three sources I’ve listed above.
Still, there’s a reason I put solar first in that list - it is our primary source of power. It generally produces between 1 and 2 kWH per day, and we monitor our usage closely enough to know that this supply is usually enough to keep up with our demand. For most of the year, any reasonably-sunny day is enough to ensure that our batteries are fully topped up. Yes, we do get some charging from diesel (and a little from propane), but it’s probably about 2-3 kWH per week when the weather is cloudy, and substantially less when it’s sunny. In other words, maybe about 10-20% of our electricity. Maybe.
So on the supply side, the carbon footprint of our electrical usage is absolutely minimal - meaning that there’s little room to reduce it further. On the demand side, we are already VERY aware of our electrical usage - we have to be - and we know that there’s not much room for reduction there either.
It hasn’t escaped my notice that we use a lot more electricity when on hookups (roughly 6 kWH/day) than when we’re not (<2kWH/day). Why is that?
Part of the reason is our fridge - when we’re on hookups, it switches from propane to 120VAC - and as I mentioned earlier, it’s not very efficient. The next time we’re on metered electricity, I might leave it on propane just to see how much less electricity we use. But the other truth is, in the rare instances when we’re on shore power, we sometimes go a little crazy: we leave lights on, use the electric blanket, even run the microwave, for Pete’s sake. Hey, it’s still only 1.7% of our carbon footprint - live a little! :^)
Laundry
 When you own your own washer and dryer, the CO2 emissions from doing your
laundry are included in your energy bills. But since we don’t, and since these
are big, power-hungry appliances, I decided that I needed to count our laundry
impact separately.
When you own your own washer and dryer, the CO2 emissions from doing your
laundry are included in your energy bills. But since we don’t, and since these
are big, power-hungry appliances, I decided that I needed to count our laundry
impact separately.
There’s not really a lot to say about it, however. I found figures that an average washer takes ¼ kWH per load and a dryer, 3.9 kWH. In 2013, we did 128 of the former and 133 of the latter, for a total energy usage of 550 kWH - which equates to 326 kg of carbon dioxide (assuming the same ratio of 592.5 g/kWH that I cited earlier). So it was only just worth counting: it’s our smallest category, accounting for just 1.4% of our total footprint for the year.
Which means that there’s not a lot to be saved here - and that’s just as well, because I can’t see any practical way to reduce our laundry load. It is what it is.
Other
I saved this category for last, not because it’s the smallest, but because it’s the catchall for any substantial impacts which didn’t fit into the regular categories above. I don’t believe that we have very many of these, but we do have a few, and below are the ones I counted in 2013. All together, they came out to 1002 kg of carbon dioxide, or 4.3% of our emissions.
Hotel Stays
All of the analysis thus far counts our impact when we’re living in the
camper - but just occasionally, we’re elsewhere. In the 2013 measurement
period, we spent 5 nights in hotels around special occasions (birthdays and
anniversaries); these are our holidays, effectively. From
 CarbonFund.org, I got a figure of
16.8 kg CO2 per hotel room-night, which works out to 84 kg for the year.
CarbonFund.org, I got a figure of
16.8 kg CO2 per hotel room-night, which works out to 84 kg for the year.
Non-RV Travel
Analagous to hotel stays, energy consumed when we’re traveling outside the RV needs to be counted separately. Some years in the past we’ve flown, but not in 2013; the only other mode of transport we’ve used has been ferries. At CarbonIndependent.org I found a figure of 0.75kg per ferry-mile (with a vehice on board), and I estimate that we traveled 162 miles on ferries during the year, for a total of 122 kg. There’s quite a large uncertainty in this figure, but it’s pretty small, so we probably don't need to worry too much about it.
 Major Purchases

As a consequence of living in such a small space, we don’t buy very much that isn’t consumable, and most of that (fuel, food, etc.) has already been accounted for here. In 2013, we only had one purchase that I felt was big enough to justify including on the spreadsheet: we replaced all 7 of the truck’s tires in January. It’s hard to say exactly what the impact of these tires was, but I found a figure of 3.5 kg CO2 per kg of tire (source). These big truck tires weigh 71.6 lb (32.5 kg) each, meaning that the carbon impact is 113.7 kg per tire, or 796 kg of CO2 for the set. This is the bulk of our “Other” emissions right here, in one swell foop - 3.4% of our annual emissions. It’s frightening.
Totals and Analysis
When you bring all of the above together, you get a grand total of 23,459 kg CO2. That’s for the year, for two of us, which equates to 11.73 T each. How’d we do?
Well, for comparison in 2012 (the last year I could find figures for), the USA produced 5119 megatonnes of CO2. Dividing that by its [2012] population of 313M gives a value of 16.35 T CO2 per capita - quite a bit higher than the footprint I’ve calculated for Teresa and I. However, it’s well established that the USA is one of the worst carbon polluters in the world, so saying that we’ve beat the national average here is no great accomplishment. Comparing ourselves to the average for Great Britain is a bit more sobering: their equivalent figure is just 7.36 T per capita.
In other words, our footprint is about 28% smaller than the average here in the USA - meaning that we’re probably emitting quite a bit less as fulltime RVers than we would be if we lived in a stationary house here. However, it’s about 59% more than the UK average, meaning that our emissions are probably higher now than they were when we lived there. These are only averages, however; I don’t have figures for what our actual impact was prior to 2013.
Looking forward, what is the future likely to hold for our carbon footprint? Well, if we can stick with our 200 mile/week average all year, that’d mean our diesel emissions would be 11,128 kg CO2. Assuming everything else remained the same as 2013, that would give us an annual total of 8.2 T each for the year: about half of the USA average, and only slightly higher than the UK. That’s pretty good - if we can keep our mileage down.